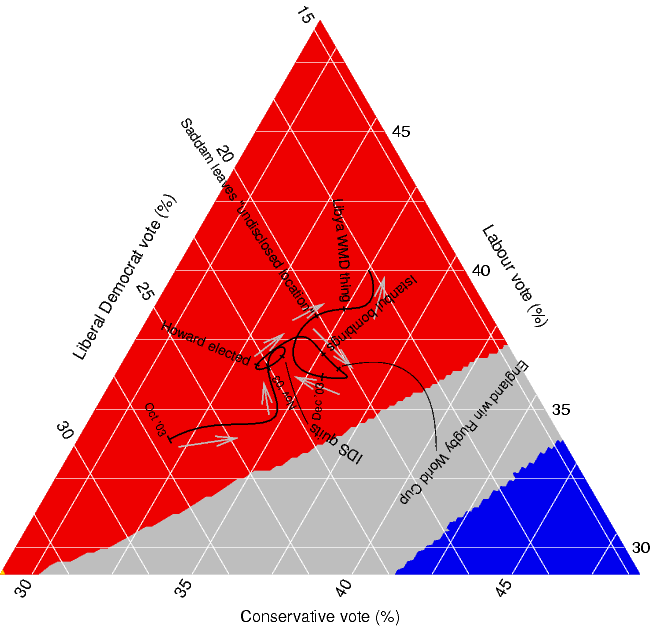
This Triangular Map shows the possible or predicted outcomes for an elections. Triangular maps have three sides, representing three different variables, which are then used to calculate some sum, in this case, total votes from the 3 represented voting classes (liberal, conservatice, labour).
Subscribe to:
Post Comments (Atom)
No comments:
Post a Comment