 http://www.i-pal.or.jp/profile/Population_Pyramid.jpg
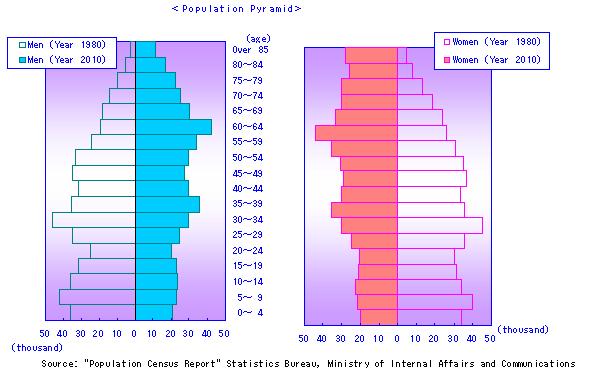
Population Profiles display information about a surveyed population, in this case, the various ages within the population. The one on the left represents the ages of men, the one on the right represents the ages of females. They have a central point, with two seperate axes extending to the left and the right. On both of these profiles, the green bars to the left show the data for 1975, and the orange bars to the right show data for 2005. These profiles are very useful when comparing sets of data.
No comments:
Post a Comment