
This is a Digital Orthoimagery Quarter Quadrangles (DOQQ) image of Washington D.C. DOQs combine arial photography with computer imaging to remove terrain relief. This particular DOQ uses infarred light, while some use black and white, or natural color.
Friday, April 23, 2010

Thursday, April 22, 2010
Ifrared Arial Photo
 http://midgewater.twdb.state.tx.us/bays_estuaries/graphics/bay.jpg
Infrared Aerial Photo used to show 7 sources of freshwater, flowing into San Antonio Bay and the Guadalupe Estuary, Texas. The variations in color show variations in sediment in the water.
Black and white arial photography

Black and White arial Photography are basically just as they sound. Photographs taken from an arial perspective, and displayed in monocrome spectrum. This particular photo shows downtown Johnstown in the 1980s, giving a clear view of the city's layout, major roads, major bodies of water, etc.
Climograph

Climographs are (typically) bar graphs, used to show the annual precipitation and temperatures for a particular region. They often share a common x-asix, which show the months, and have their own, appropriate y-axises, showing either measure of rain or temperature. This Climograph also included a graph in the middle, which tracks the variations of the sun, from 23.5 degrees south, to 23.5 degrees North, because this climograph is comparing low latitude, tropical areas between the Tropic of Capricorn & Tropic of Cancer.
LADAR
 http://vulcan.wr.usgs.gov/Volcanoes/MSH/Eruption04/Monitoring/ImagesGraphics/LIDAR_crater_dome_sept03_and_nov04_animated_small.gif
LIDAR, or Light Detection And Ranging, is a method, much like radar, that uses pulses of scattered light to form an image. This image shows the topography of Mount St. Helens, and is actual an animation, switching between two LIDAR images, to show the changes occuring in the crater of Mt. St. Helens
Triangular Plot
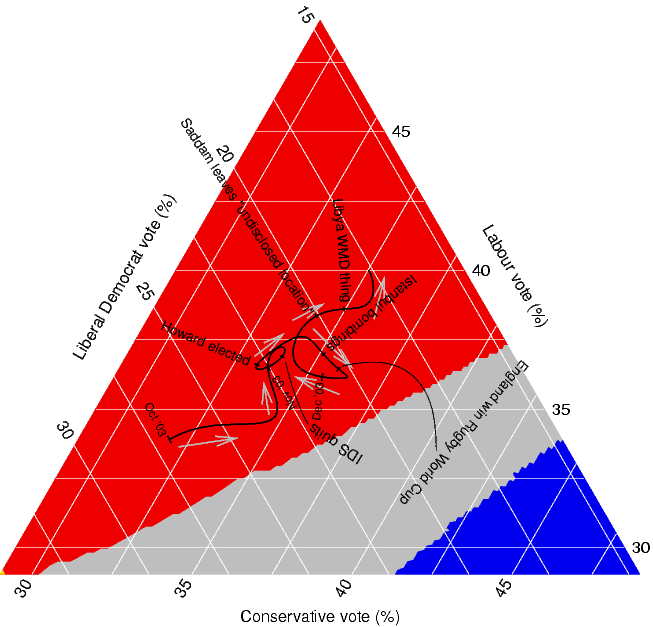

This Triangular Map shows the possible or predicted outcomes for an elections. Triangular maps have three sides, representing three different variables, which are then used to calculate some sum, in this case, total votes from the 3 represented voting classes (liberal, conservatice, labour).
Coorelation Matrix

Correlation Matrices show relations between two variables, one along the x-axis, one along the y-axis, with their shared cell indicating a value, and/or color corresponding to that value. This correlation matrix shows correlation between the cluster moments for electrons and pions.
Subscribe to:
Posts (Atom)