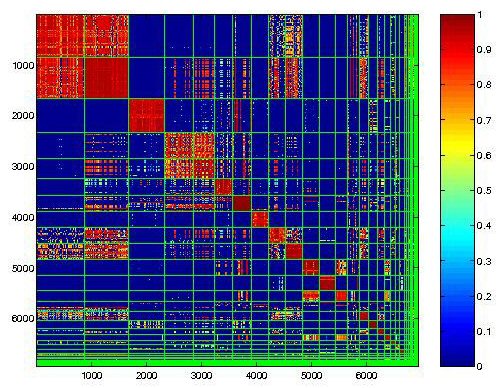
Similarity Matrix express the similarity between two data points. This Matrix shows the similarities in synopsises, with high values, 1 being the highest, and represented by the color red, are assigned to most similar variables.
Thursday, April 22, 2010

Flow Charts
 http://pangea.tec.selu.edu/~abolin/etec645/fproduct_1.jpg
Flow Charts use arrows between boxes to show progression of information or events. This one shows events in the life of a girl, Molly, and how one lead to the other.
Histogram

Histograms are bar graphs showing frequency (y-axis) of certain variables, in this case number of weeks (x-axis). This histogram shows the number of weeks spent waiting for a contraceptive order.
Isopachs
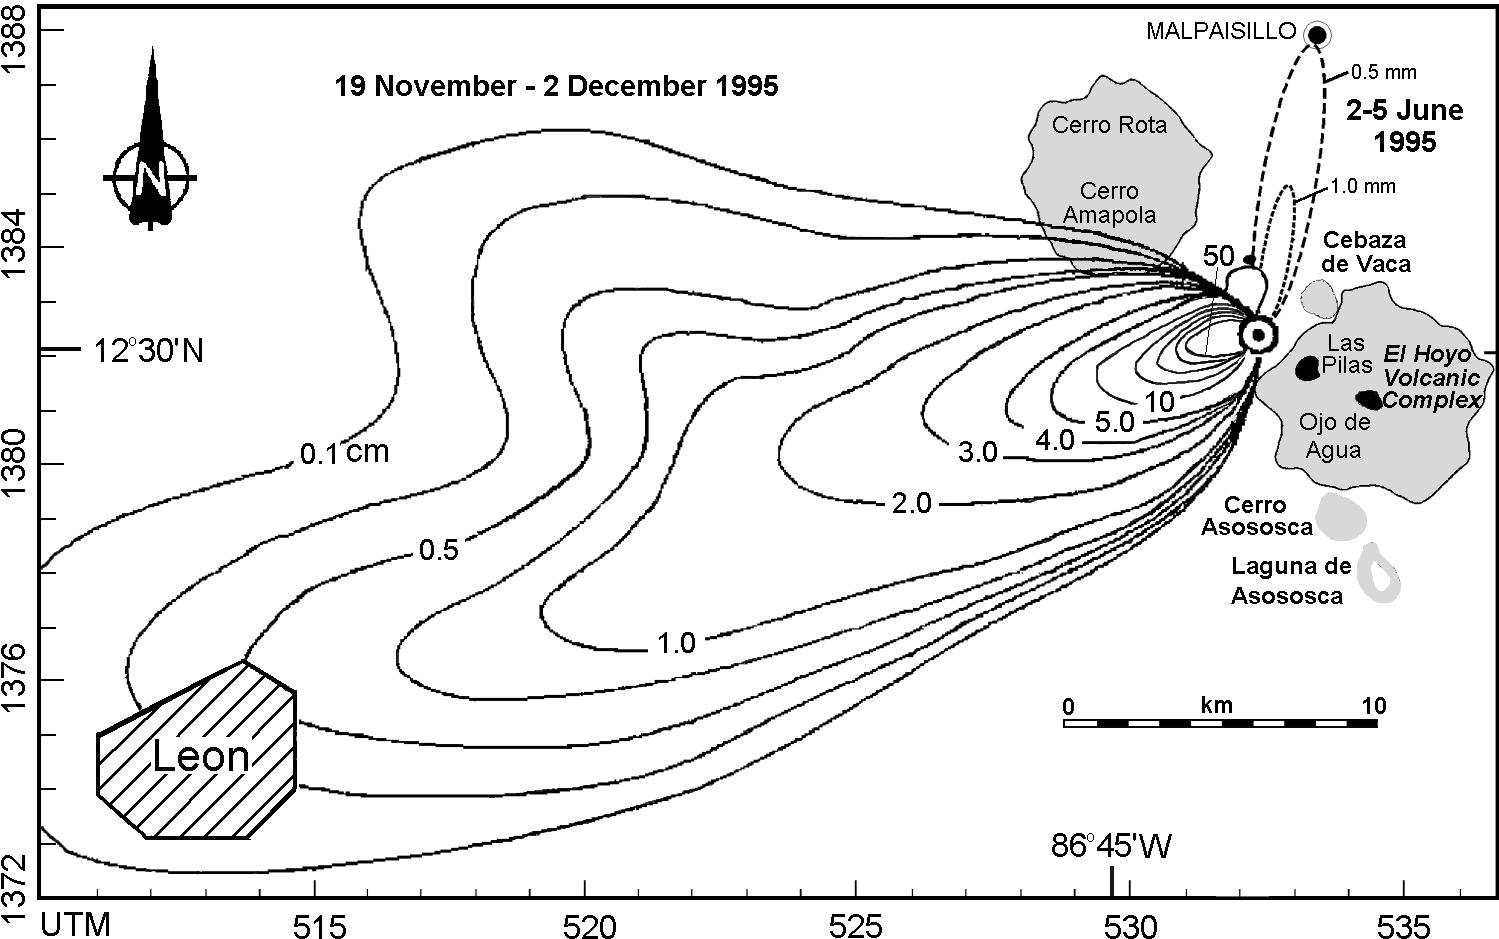
Isopach maps use contour lines to show variations in thickness. This maps shows variations in thickness of ash falling from the volcano Cerro Negro.
Isohyets

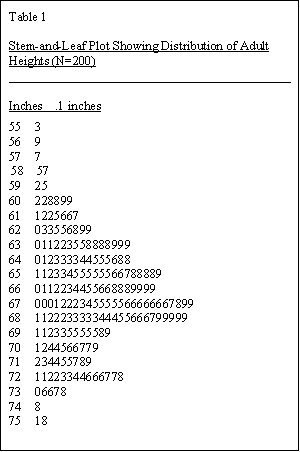

This isohyets shows the mean annual rainfall in Tasmania, using different colors to correspont to different precipitation levels, with the key shown to the left.
Isobars
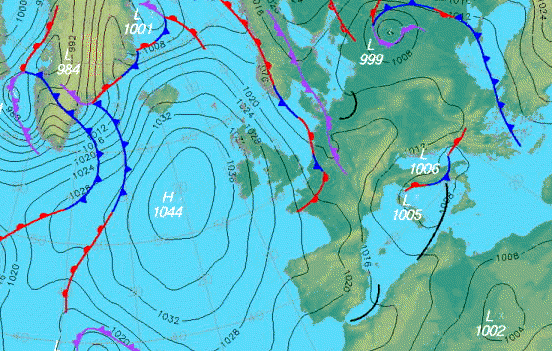 http://www.halesowenweather.co.uk/isobars.gif
Isobars are graphs using lines to connect areas of equal relevance, in this case, connecting equal atmospheric pressures across Europe.

Isotachs
 http://www.erh.noaa.gov/btv/events/28Oct2008/300mb_isotachs_28_18z.gif

Isotachs use contour lines to show wind speeds. This map shows winds, supperimposed over the United States, with various shades of white-blue representing different wind speeds.
Subscribe to:
Posts (Atom)