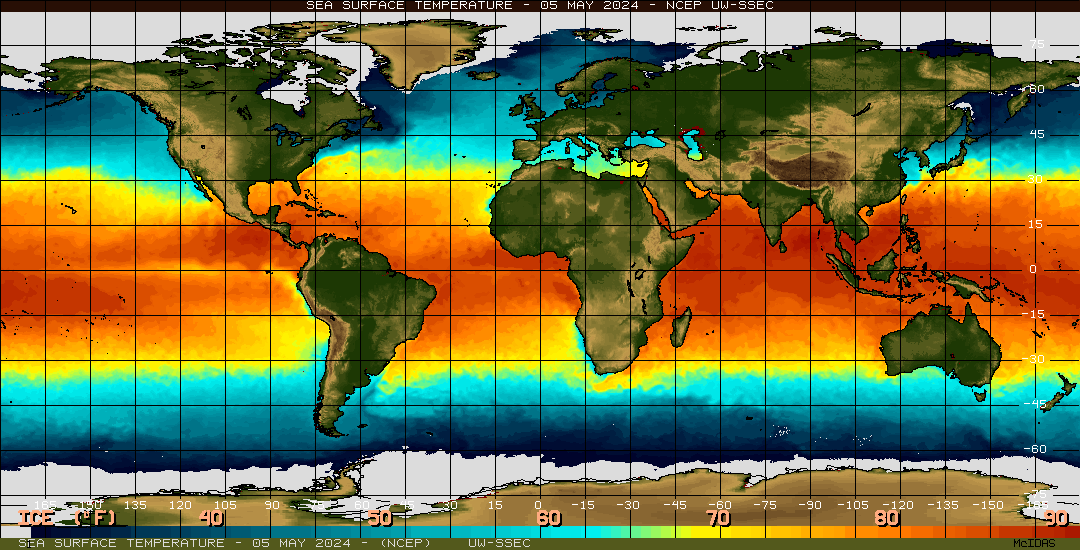
This is a thermal map, using color variation to show surface temperatures across the globe. Warmer waters, found around the tropics are indicated with shades of yellow and orange, whereas colder waters, found around the poles, are shown in shades of blue.
Friday, April 23, 2010

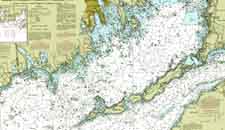
Nautical Map

Nautical Maps are used to navigate the waters. They typically show major land formations, and have numbers throughout the waters to show depths. Modern ones often show markers, buoies, good spots for anchoring, and other such maritime information. This chart also has isolines to show similarities in depths.
Handgun Shooting Symptom Chart
 http://www.pointmanspage.com/gallery/main.php?g2_view=core.DownloadItem&g2_itemId=7670&g2_serialNumber=3
The maps above are shooting charts, used to show a shooter what they may be doing wrong when shooting. It takes the standard bullseye, but breaks down the areas around the bullseye to show what would cause the shooter to hit there, rather than the bullseye.
For example, according to the map on the right, if a left handed shooter is shooting way above the center of the target, they are "breaking too soon".
Mind Map
http://techknowtools.files.wordpress.com/2009/04/mindmap_2.jpg?w=500&h=389
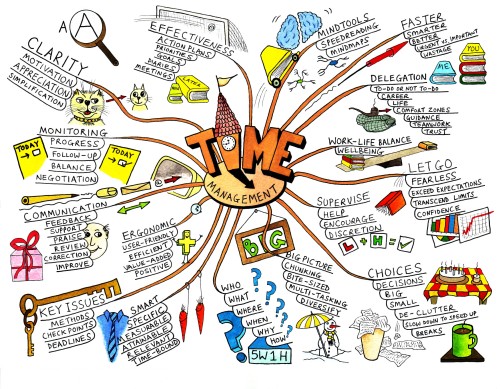
Mind Maps are diagrams that convey ideas, tasks, goals, or other such concepts that all pertain to a central idea. They are much like circle maps, however, they are typically more graphical, and use a branching technique to emphasize importance. Larger branches are more important, small branches being less important.
This map focuses on "time management", branching it off into various categories, with subdivisions under each.
Mental Map
 http://www.uneetee.com/category/image/detcol_Cat_HumanMap1.jpg
This Map is supposed to be on the front of a t-shirt. It takes what looks like a typical subway map, but uses it to map the human body. The pink line shows the heart, the green line shows the lungs, the yellow line the stomach, and the blue line the intestines. Its a unique spin on diagraming the human body.
Star Plot

Star plots map multiple varibles, for multiple data sets. This star map plots the Mass, Acutator Saturation, Deflection, Acuracy, Collision, Trajectory Completion, time, and mass, each one indicated by a different spoke, for 5 different designs, each indicated by a different color lined. It is a way of mapping more than just one variable (like your standard XYGraph).
Isoline Map
 http://www.lib.utexas.edu/maps/atlas_mexico/mean_annual_precipitaion.jpg
Isoline Maps use contour lines to join points of the same value. This map shows the precipitation rates of Mexico. This map is also a topographic map, showing the 3D relief of the land, as well as an isohyet map, because it specifically has lines of common precipitation.
Football Play Diagrams
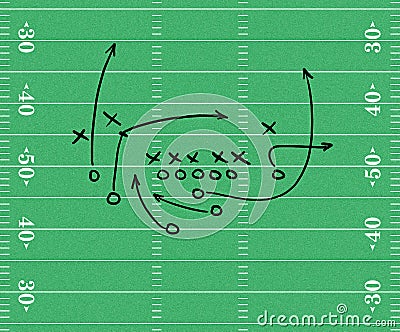
Sport Play Diagrams are examples of maps, showing the starting positions of players on the field, and their intended paths. In this football play diagram, circles reprents plays on the offense, x's represent players on the defense, and arrows show the paths the offensive players should run once the play starts.
Family Pedigree
 http://media-2.web.britannica.com/eb-media/84/784-004-C9BAE345.gif
Family pedigrees are used to track a genetric trait throughout a family. This pedigree tracks the presence of Hemophilia A throughout a family. Circles represent famales, squares represent males. Light blue represents individuals who do NOT have hemophilia A, dark blue represents individuals who do have hemophilia A. The Shapes that are half light blue, half dark blue indicate individuals who carry the gene for hemophilia, but do not actualy express it.
Geneticists use these charts to try and identify instances, and predict the likelithood of an offspring having that trait.
Family Tree

Family trees are examples of maps, showing marriages, offspring, and various relations, over the course of several generations. Often times, horizontal lines connecting two dots show marriage, where vertical lines show relationships between parent and offspring.
Gel Electrophoresis Diagram

Gel electrophoresis diagrams show seperated DNA proteins, and are used in forensics, genetics, microbiology, etc. They are made by inserting DNA into a gel matrix, and running an electric current through. The proteins seperate based on density and weight, and shown under a UV light, to create the diagram above, which can be read by scientists to determine information about DNA. The shade of the lines (reprenting proteins), their proximity to one another, and their overall location all reveal information regarding the proteins.
Star Maps

Star Maps are used to show stars, obviously, often times superimposing constellations over top. This map is an example of a star map, for a the Northern Hemisphere, on a winter night.
Pictograms

http://www.tiresias.org/research/guidelines/images/iso_pictograms2.jpg
Pictograms, are ideograms that show a series of symbols. This one displays various public information symbols
Pie Graph


Pie Graphs take a circle, and divide it into slices, which are proportional to some variable. This pie graph shows the major causes of deforestation in the Amazon. For example, cattle ranches account for 60% of the deforestation in the Amazon, therefore they take up 60% of the circle. Large scale commercial agriculture only causes 1% of the deforestation, therefore it only takes up 1% of the circle.
Scatterplot

Scatterplots use single dots to plot data points on an XY axis. This plot shows the correlation between years of experience in a career and income, with a trend line showing the best fit line to represent this data.
Venn Diagrams

Venn Diagrams use circles to list information, and their overlapment indicates common charateristics. Information in the part of the circle that is not shared with any other circle applies soley to that circle. For example, in this one, only lizards have scales ane are reptiles. Infomation that is listed in overlapping parts of circles applies to both. For exaple, both Lizards and dogs have 4 legs.
Bubble Maps

This is an example of a bubble map, which use circles, centered around a central idea, to show information related to that central idea. For example, this bubble map describes rain (in the central circle), using adjectives (in the surrounding circles).
Windrose
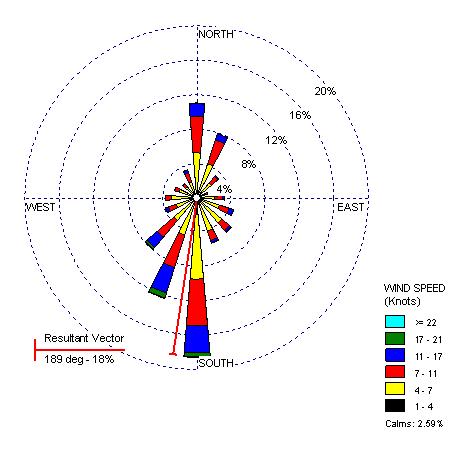
Windroses are graphs used by meteorolgists to convey wind speed and direction around a particular location. The colors are representative of the speeds, where as the length the spokes extend correspond to the frequency of the wind in that particular direction. This windrose shows information about Seattle, WA.
Population Profiles
 http://www.i-pal.or.jp/profile/Population_Pyramid.jpg
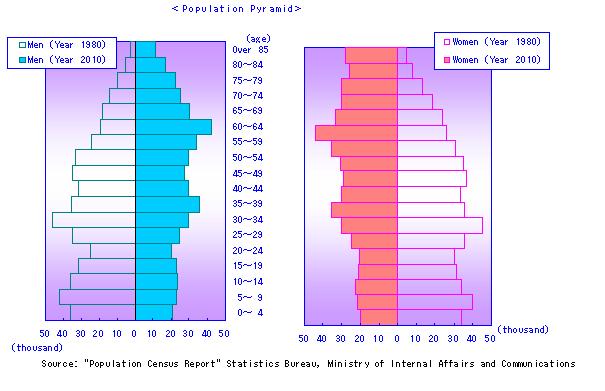
Population Profiles display information about a surveyed population, in this case, the various ages within the population. The one on the left represents the ages of men, the one on the right represents the ages of females. They have a central point, with two seperate axes extending to the left and the right. On both of these profiles, the green bars to the left show the data for 1975, and the orange bars to the right show data for 2005. These profiles are very useful when comparing sets of data.
Box Plot
 http://www.itl.nist.gov/div898/handbook/eda/gif/boxplot0.gif
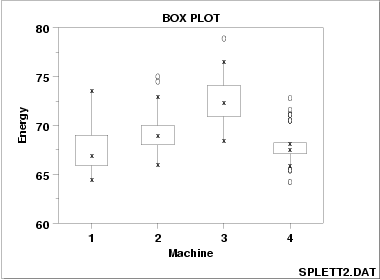
Box Plots display the "five number summaries" of specific data sets. These plots show the minimum, lower quartile, median, upper quartile, and maximum for a specific variable. This plot shows the five number summaries for the energy outputs of Machines 1, 2, 3, & 4.
Subscribe to:
Posts (Atom)